
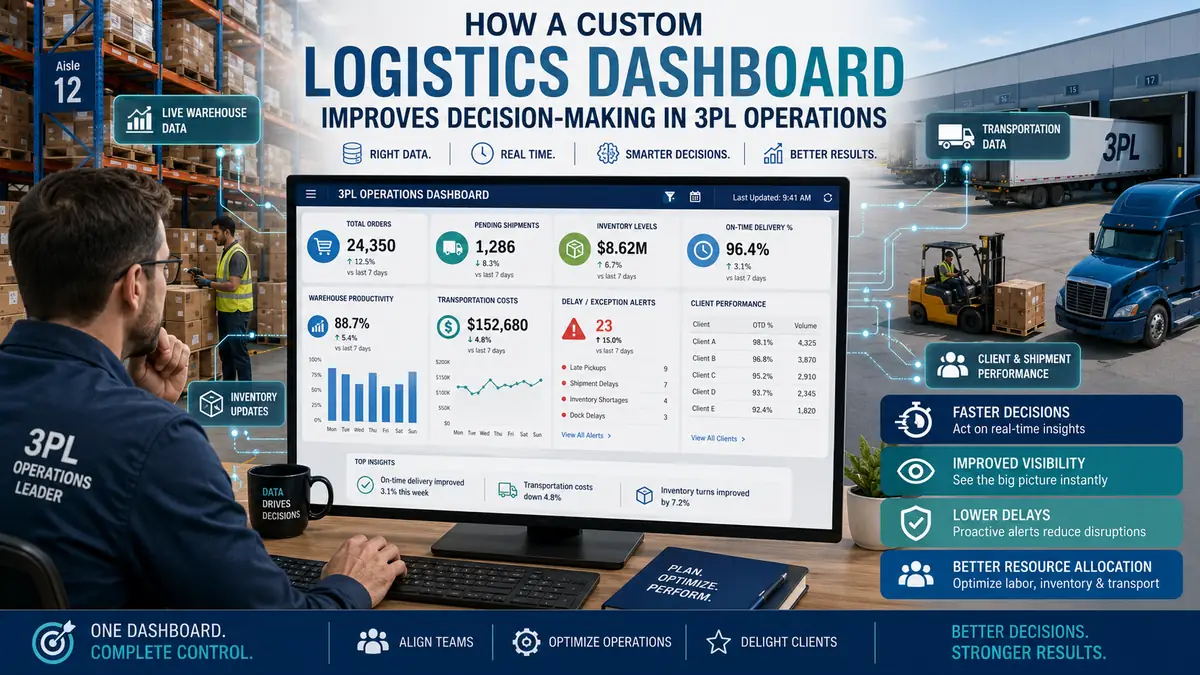
A 3PL operation can generate plenty of data and still leave managers unsure about what needs attention. Order statuses may sit in one system, delivery updates somewhere else, billing information with finance, and client reports in spreadsheets. By the time someone combines everything into a report, the operational problem may already have moved on. A custom logistics dashboard is more useful when it shows the information managers actually need to make decisions, instead of displaying every piece of data the business collects.
More charts do not necessarily help managers make better decisions. A useful dashboard should help an operations manager spot an exception, see what it affects, trace it back to the relevant transaction, and decide what to do next.
Quick Answer: How Does a Custom Logistics Dashboard Improve Decision-Making?
A custom logistics dashboard brings selected operational data, KPIs, exceptions, and trends into a view designed around a specific user’s responsibilities.
For a 3PL, an operations manager might see orders approaching SLA limits. Meanwhile, finance could see completed activities awaiting billing, while the client-service team sees delayed deliveries or missing proof of delivery.
The point is to show each user the information that matters to their role, so they spend less time searching through data and can act on it sooner.
Why a Logistics Dashboard Matters as 3PL Operations Grow
The reporting problem changes once a 3PL starts handling more clients, locations, orders, billing rules, service levels, and delivery partners.
A spreadsheet or fixed report might work when an operations manager can personally keep track of most exceptions. At higher volumes, that approach becomes difficult because the important event can be buried among hundreds or thousands of normal transactions.
The 2025 Third-Party Logistics Warehouse Benchmark Report is based on responses from more than 200 3PL warehouses. The report highlights operational technology and automation issues, including rising concern around uncaptured billing charges and lack of automation.
This is also where spreadsheet-based reporting becomes difficult to manage. If your team has to combine several files just to answer basic operational questions, getting the information itself is already taking too much time. See the related discussion on when 3PL management has outgrown spreadsheets.
Generic Reporting vs. a Custom Logistics Dashboard
A standard dashboard often starts with available data: “What KPIs can the software display?”
A better custom dashboard starts somewhere else: “What decisions does this person need to make?”
|
Generic reporting approach |
Custom dashboard approach |
| Same KPIs for most users | Different views by role, client, site, or responsibility |
| Shows large amounts of activity | Prioritizes exceptions and decision-critical information |
| Fixed reporting structure | Metrics reflect relevant SLAs and operating rules |
| Users search for the underlying issue | Drill-down connects the KPI to orders or transactions |
| Primarily explains what happened | Helps determine where attention is required |
Custom does not mean every manager should design a completely different screen. That creates another maintenance problem.
A better approach is to keep the same KPI definitions across the business while giving teams different views based on what they are actually responsible for.
How a Logistics Dashboard Helps 3PL Teams Make Faster Decisions
Consider an outbound operation processing orders for several clients.
A normal summary may show today’s total order volume, completed orders, and pending orders. Those numbers are useful, but an operations manager still needs to work out which pending orders are actually at risk.
A better logistics KPI dashboard might separate:
- orders progressing normally;
- orders approaching their SLA threshold;
- orders waiting for an operational step;
- orders with QA or documentation exceptions;
- ageing exceptions that still have no resolution.
Now the manager has a work queue, rather than another report to interpret.
This need for timely data is broader than 3PL alone. MHI’s 2025 MHI Annual Industry Report, produced with Deloitte, identifies demand for accurate real-time data as an important supply chain issue. The research notes that without timely visibility, leaders struggle to make data-driven operational decisions.
The same applies when a 3PL is processing a high volume of orders. If segregation, prioritization, documentation, and dispatch depend on one another, managers need to see which stage is actually causing the delay. This is one reason high-volume order management challenges become harder to manage through summary reports alone.
Why a Logistics Dashboard Should Differ Across 3PL Roles
A useful supply chain dashboard should reflect responsibility.
Logistics Dashboard for operations Manager
The operations view may concentrate on order backlog, SLA risk, inbound and outbound exceptions, QA status, pending dispatches, returns, and unresolved operational issues.
The manager needs to know: Where is work getting stuck, which orders are affected, and who needs to act?
Logistics Dashboard for Finance Teams
Finance needs a different picture.
For example, relevant information could include completed operational events awaiting billing, invoice status, receivable or payable exceptions, missing documentation, ageing disputes, or charges requiring review.
This connection matters because operational work and billing are often handled by different teams. Our article on 3PL revenue leakage caused by manual billing explains the risks created by that disconnect.
Logistics Dashboard for Client-Service Team
Client-service staff may care more about delayed orders, exception ageing, proof-of-delivery status, delivery updates, and client-specific SLA performance.
Giving them a relevant view can reduce the time spent asking operations teams for updates.
Logistics Dashboard for Senior Management
Executives generally need trends rather than transaction-level noise: order volumes, service performance, exception patterns, billing cycle indicators, operational capacity, and performance by client or location.
They should still be able to drill down when a trend needs investigation.
A Logistics Dashboard Should Show What Needs Attention
One of the easiest ways to ruin an operational dashboard is to keep adding KPIs.
If 35 metrics all appear equally important, the dashboard has avoided making any decision about priority. The manager has to do that work instead.
A more useful design asks three questions for every metric:
What decision does this metric influence?
At what point should someone act?
Who owns that action?
This is similar to the distinction made in Supply Chain Control Towers: Visibility Plus Action. Supply Chain Management Review notes that visualization alone is insufficient; useful operational visibility depends on timely warnings, action, clear decision authority, and accurate data.
A dashboard is more useful when it draws attention to exceptions instead of giving every transaction the same level of importance.
How Logistics Dashboard Data Moves From Event to Action
The underlying process is more important than the chart design.
Operational Event
↓
Validated Data
↓
KPI / Business Rule
↓
Threshold or Exception Detected
↓
Dashboard / Alert
↓
User Drills Into Order or Transaction
↓
Corrective Action
↓
Outcome Recorded and Reviewed
For example, an order approaching an SLA threshold should not simply turn a chart red. The user should ideally be able to identify the affected order, understand its current stage, and determine who owns the next step.
This is where logistics analytics starts helping with day-to-day operations. The data becomes part of the workflow instead of something managers review only in a separate monthly report.
What Should a 3PL Put on a Logistics Dashboard?
Start with decisions, then choose metrics.
For daily operations, useful measures may include order status, SLA exceptions, pending operational stages, delivery exceptions, QA issues, unresolved returns, or documentation gaps.
For management reporting, trends such as order volumes, exception rates, processing times, billing status, client performance, and location-level comparisons may be more relevant.
The exact KPIs should depend on the business model. A 3PL handling retail distribution may need different views from one handling bulk shipments or specialized goods.
Client contracts matter too. If two customers have different SLA definitions, a single generic KPI may produce a misleading picture.
Where a Logistics Dashboard Can Fail
A custom logistics dashboard cannot repair poor underlying data.
A dashboard cannot compensate for late status updates or identifiers that do not match across systems. The same problem occurs when employees bypass required workflow steps or departments calculate the same KPI differently. In these cases, the dashboard may simply present bad information more efficiently.
Before relying on the dashboard, teams also need to get the basics right: data ownership, KPI definitions, integration quality, refresh frequency, access permissions, threshold rules, and user adoption.
How well the dashboard works will also depend on the quality of the underlying workflows and data, the integrations in place, implementation effort, team adoption, and the size and complexity of the 3PL operation.
Customization carries maintenance costs as well. If every client request creates another special calculation or screen, reporting can eventually become difficult to govern.
For businesses deciding how much flexibility they actually need, our custom 3PL software vs. ready-made systems comparison explains the difference between configurable software and deeper customization.
How to Decide What Your Logistics Dashboard Should Show
Before selecting charts or software, take one recurring operational problem and work backwards.
Ask what decision is currently delayed. Identify the person responsible for that decision. Determine which data proves that action is required. Then define the threshold, exception, or trend that should appear on the dashboard.
If a metric does not change a decision, trigger an investigation, support a client conversation, or help measure an agreed target, question why it needs prime dashboard space.
Working backwards from an actual decision is usually more useful than starting with a long list of KPIs and deciding which ones to display.
FAQs:
Q. What is a logistics dashboard?
A. A logistics dashboard is a visual reporting interface that brings selected logistics data, KPIs, trends, and exceptions into one view. In 3PL operations, it may combine information related to orders, service levels, operational processes, delivery status, billing, or client performance depending on the user’s role.
Q. How Is a Logistics Dashboard Different From a Standard Report?
A. A report usually summarizes information for a specific period. A logistics KPI dashboard is designed for continued monitoring and may include current status, thresholds, exceptions, trends, and drill-down information that helps users investigate performance.
Q. Does Every 3PL Need a Custom Logistics Dashboard?
A. No. Smaller or relatively standardized operations may be well served by configurable standard reporting. Customization becomes more useful when clients, workflows, SLAs, locations, billing models, or management requirements differ substantially.
Q. Can a Logistics Dashboard Improve 3PL Decisions Automatically?
A. No. A supply chain dashboard improves access to relevant information. Decision quality still depends on accurate data, sensible KPI definitions, clear ownership, experienced managers, and the ability to take corrective action.
Conclusion
A custom logistics dashboard should make it easier to answer the questions managers deal with every day: What has gone wrong? Which orders or clients are affected? How serious is the issue? Who needs to handle it, and what happens next?
For a 3PL, the dashboard should focus on the decisions teams need to make, the exceptions they need to act on, and the responsibilities they own. There is little value in filling the screen with metrics that nobody uses.
Start with one recurring decision that currently takes too much time or manual investigation. If the dashboard can make that decision clearer and faster without hiding the underlying detail, it is doing useful work.


